Fourier Representation
Let's say we're really comfortable with the idea of infinity.
And that perhaps, you're pretty good at counting. After all, counting is simple, isn't it? So we count. One, two, three, four, so on and so forth. We'd have all the numbers in the world to work with! Now, we're given a simple task: Given a function, we've got to draw a graph; perhaps a simple straight line. But we haven't any rulers or straight edges or whatnot: we've got to count, and draw a straight line pretty neatly:
One way we could try to draw this straight line would be to throw numbers at the functions, giving us points to work with. We keep the set of coordinates as and regularly put the points down on a typical Cartesian coordinate plane, like so:
But hey, you say, 5 points don't make a nice straight line! Of course it doesn't. So let's repeat it with more and more points. We had 6 points there, one for each integer from 0 to 5. We could half our intervals, for a total of 12 points. Halving it again gives even more, and after awhile our collection of points start to resemble a straight line graph. After all, what is a plotted graph but an infinite collection of points that describes an input with its output? We chose to describe our function as a collection of inputs and outputs, like any logical person would do.
Enter Joseph, a not-so-logical person.
Now Joseph here is a little eccentric. He lives in his own world, babbles about keeping his boundaries and most of all, hates counting. Absolutely terrible at it. Can't count past the fingers he has for goodness sake. But that doesn't deter Joseph from doing math; he loves it! Instead of counting, Joseph is amazing at drawing curves. Curves of regular intervals and curves with specific shapes. Specifically, Joseph draws sines and cosines like they're nothing. Just as easily as you count points and keep them. Joseph is given the same problem: given this same function, draw it out! After some infinite period of time, you've completed your graph and you've decided to peer over and see how Joseph tackles this problem. You peek over, and see, on a similar Cartesian plane to yours:
Well now the madman's done it! He's lost his sense of math! You think to yourself. How on Earth is that curve (a sine wave, to be precise) going to ever resemble the function? Sure, about 3 points coincide with yours, but the rest are vastly different! However, Joseph proceeds to draw yet another sine wave, this time more packed and squeezed, and now in red, across the same domain from 0 to 5:
And he starts adding these two waves together. It doesn't seem like much:
But hey, now it intersects 4 times instead of 3! Plus, the differences are growing to be smaller. Undeterred, Joseph does it again. Again and again. Draw another sine wave, a little more packed than the previous, adds them up and draws it again. After 8 waves, he gets this:
And after 16:
Before you know it, at the 500th set of sine curves he's added:
Bar the weird kink at the start, he's pretty much got the rest of the straight line nailed down! The man has done it; he's used a bunch (perhaps an infinite number) of sine waves to get a straight line! In approaching the same problem, two methods were used, an infinite number of simple counting and an infinite number of added sine waves. Why is the second approach even valid? Who even came up with it?
Jean Baptiste Joseph Fourier1 , 1768 - 1830 did.

Fourier, a mathematician and physicist, published in 1822 a work on how heat flowed in a piece of metal. However, in this piece of work, he also revealed a mathematical technique that would eventually shape an entire new way of treating and approaching mathematical problems like the ones we dealt with earlier: Fourier established that any smooth function could be represented as a series of trigonometric terms. Just as we used a straightforward way to establish the function earlier by computing an infinite collection of points, Fourier says that we could have done so just as easily with an infinite sum of trigonometric (sine and cosine) terms. This study of functions expressed as trigonometric terms is known as Fourier Analysis.
This little reading will not dive into too much details and mathematical rigor in Fourier Analysis; instead, I'd like to introduce some of the more conceptual aspects of it. There is some math, of course; but none that requires you to think too much about and compute. In the example earlier, Joseph (whose name was totally not chosen as such because of Fourier) chose a set of sine waves to add: how did he arrive at these specific set of sine waves, and what makes them special? Joseph's approach to approximating the straight line is as follows:
For example, in the expansion with two terms (see above, blue graph), it is the same as setting . He approximated our function as:
If the pattern continued, one can see that increasing would cause the trigonometric term to oscillate even faster: they are known as harmonics of the first term, the fundamental. You may intuit this concept as the fundamental providing the bulk of the approximation; the subsequent harmonics serve to fine-tune the shape of the fundamental to finally match the function. An extremely familiar parallel here is Taylor and Maclaurin's Expansions of functions; re-writing the same function as a summation of terms; the more terms, the better the approximation through calculus. For this reason, we call the Fourier representation a Fourier Series. Thus, we see here that we can express a straight line equation by an infinite summation:
Why use the Fourier Representation?
Expressing equations and functions in its Fourier representation has many uses. For one, solving the equation itself! This was the main reason for Fourier introducing this method in his paper on heat transfer: the function that governed the transfer of heat through systems was a second order partial differential equation. Most times, differential equations, which are functions that involve a variable and its derivatives, are complicated to solve. Solving simultaneously, a variable, as well as its derivative, is extremely tricky because its hard to keep track of one while keeping the other consistent with the equation. If one is able to get the Fourier representation of the equation, it becomes significantly easier to solve, because of the following two properties:
These 2 properties allows us to easily relate any combination of sines and cosines to each other (for example, if the Fourier representation is made of sines and cosines, I could use the first equation to rewrite all cosines back to sines) and even vastly simplify the difficulty of keeping track with the derivatives: differentiating sine twice simply gets me back the sine function, with an extra negative sign. In principle, we've solved the 'differential' part of second order differential equations, and we now know that any solution must look like some form of a trigonometric expression! This preserved behavior is known as an eigensolution and the concept of self-solution will be revisited in a later part of the course. Here, we say that trigonometric expressions are eigensolutions to the second differentials; thus if our equation is expressed as trigonometric terms, the solutions will show up very easily. You will try your hands at solving a second order differential equation when solving the particle in a box: it is then you will see how sines and cosines are useful in solving the problem!
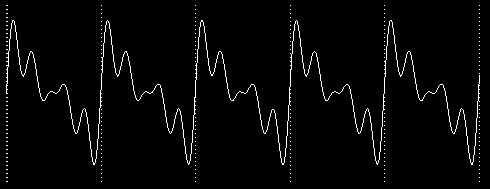
Another use of Fourier representation is to gain more insight into a potentially noisy and significantly complicated signal, like such:

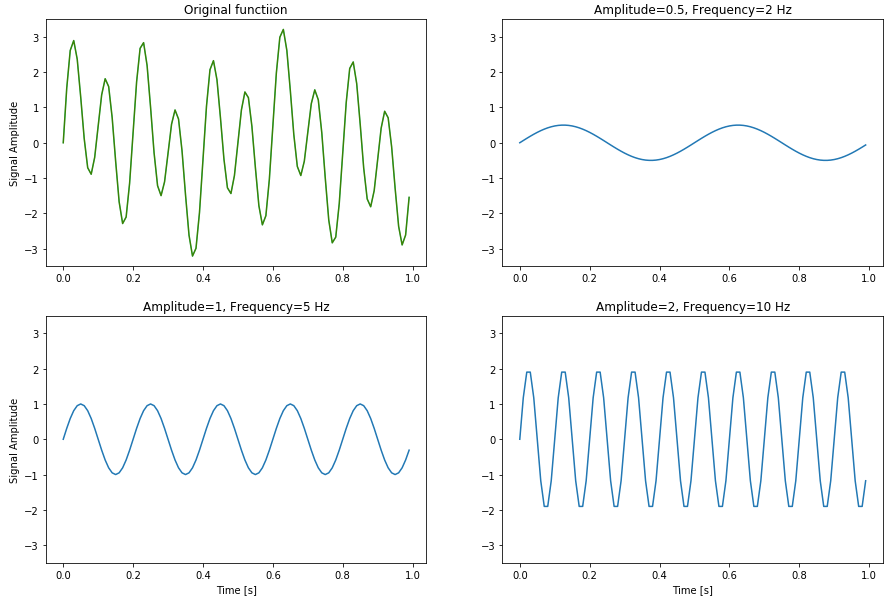
An algebraic expression of the above form definitely exists; but its not going to be friendly or easy to understand. (maybe several hundred terms are needed as a polynomial?) However, the function definitely looks periodic, and thus would be feasible to decompose it to its Fourier representation. For example, the following graphic shows a similar periodic function, decomposed to 3 components, i.e. the 3 sine/cosine terms that contribute the most to the overall expansion{2}:

This tells us that the signal is really primarily made up of these 3 waves. Using Fourier transform is therefore an extremely important tool when processing digital signals.
Getting the Fourier Series and the Fourier Space
The Fourier Coefficients
Generally, a Fourier Series takes the most generic form of:
In a Fourier Series, can be thought of the period of a function. This is typically the limits of which one would wish to find the Fourier Series of (in the first example, the limits go from to ). represents the harmonics of the terms; is the fundamental, and the first term of the expansion, while higher values of refer to the harmonics. Thus, we are left with finding the and , coefficients that may vary with each value of . This is tricky; how do we get an infinite number of coefficients (remember, goes from 0 to infinity!)? For practical purposes, we usually truncate our Fourier Series to a finite number of terms, where we find the error of margin acceptable for whatever purposes we have. There are several cases where and can be exactly and analytically solved, but they are not common. The method to obtain these coefficients, regardless of simplicity to solve, are to project the function to each trigonometric term.
What?
Projecting a function to a term? What does that even mean? Buckle up, because we are beginning to get into the more abstract part of Fourier analysis and why it is so powerful. First, let us clear up what it means to project, at least in math. Just as in the example above, where you expressed what you see in the world (of 2-dimensional spaces) with discrete points that you counted, Joseph expressed them in sines and cosines. These are the most fundamental of languages in which you use to describe a function. Another example, if you are familiar with vectors and spaces, is the choice of coordinate systems. Any vector can be represented as a simple arrow, but fundamentally has no meaning unless one describes the vector by a choice of a coordinate system. The most common, being the typical Cartesian coordinate: admits a vector to be expressed as . However, a person who may have lived his entire life rotated diagonally from you would see his Cartesian coordinates slightly different; 45 degrees off of yours, to be exact. In the figure below, this rotated person's coordinate system would be the two lines in blue and green, while yours would be the black ones which we are all familiar and comfortable with.
Projecting a vector to your coordinate system means to express, in terms of your coordinate choices, the singular numbers that are used to describe this vector. However, if the rotated person were to use their coordinate system to express the vector, the numbers used would be very different from yours. For example, imagine reading off the and values of the following purple vector [2, 0.7]; now try reading off the and values of the rotated persons' axes, (Remember, project by drawing a perpendicular line to the blue and green vectors!) and convince yourself that the values you get are different. Even though everyone agrees on lengths, they do not agree on the numbers used to describe the vector. Thus, the choice of coordinate systems changes the way we see the same object, just as we saw the straight line differently from Joseph.
Now that we understand the idea of projection, we can try to tackle what it means in the context of a Fourier Series. Just as an x or y axis, there is an abstract equivalence that cosine and sine terms are perpendicular to each other; that is to say with a combination of 2 numbers/values/thingamajigs, one can describe functions in 2 dimensional space, just as you do with and which are themselves perpendicular to each other. Some properties of Cartesian coordinates, and their respective intuitive duals to Fourier series are shown.
Mathematically, projecting a vector onto a choice of coordinate systems, here represented by and , involves taking the dot products of the vector to those basis and then using those numbers obtained to represent the vector. Therefore, to represent a function in Fourier "space", we take the corresponding "Fourier dot product" of the function to the "basis", which are the sine and cosine functions. If we let the function that we wish to project to Fourier space be , then it looks like:
You might be beginning to see a pattern about the "Fourier dot product" and the integrals showing up. Methodically, if one goes through all of these, or if by some sheer mathematical trickery one is able to obtain a generic expression for and , the problem of getting the Fourier coefficients is solved, and we have ourselves a Fourier Series.
Fourier Space
Let's go a little back to our example of ours and our rotated friend's coordinate systems. At this stage, we have agreed to disagree on how to describe the vector. However, can we perhaps start to see things from his perspective; maybe do a little rotating ourselves so that we can really convince ourselves that we are seeing the same thing and getting the same numbers? This transformation of coordinates is known as coordinate transformation (what a pleasant surprise, 50 points to Mathematics for their creativity!) and is how we 'change our basis' and describe the same system differently. In Physics, coordinate transforms are important because some problems and solutions are easily solved in a different coordinate system. Examples are a spherical/elliptical coordinate system when working with planetary motion and orbital mechanics or just a rotated Cartesian coordinate system for mechanics on an inclined plane, such as now where our dear friend Vincent is rotated (it is also at this stage I realize I am frequently referencing him without a name, he shall now be named Vincent for lack of creativity).
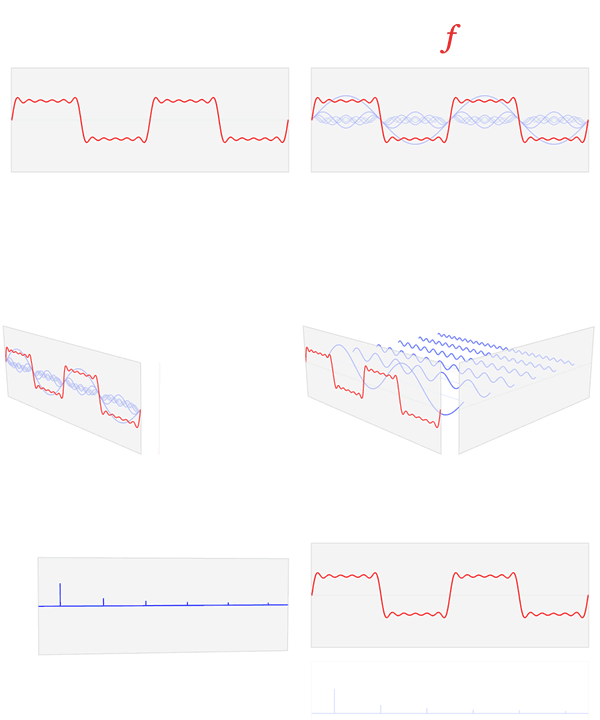
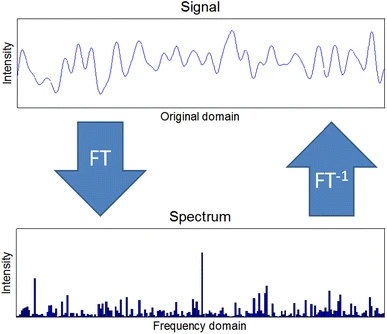
If we were to rotate ourselves 45 degrees, and the rules upon which we use to do so are also equivalently applied to our measurement of the purple vector, we would find ourselves very much in agreement with Vincent. I will not go into the details of coordinate rotation, but feel free to read it up on the internet; there's plenty of resources and questions about rotating an axis 45 degrees. If a coordinate transform allows us to go from your perspective to Vincent's, is it possible to go to Joseph's? Is it possible to intuitively see the world and describe it mathematically with sines and cosines as its building blocks? It is indeed possible, with a few restrictions here and there, but it can be done! This is known as the Fourier Transform, and takes us from real space to Fourier space, commonly also known as frequency space, frequency domain or space. Correspondingly, going from the Fourier space back to real space is known as the inverse Fourier Transform. The .gif below shows a famous graphical representation that is found on Wikipedia; a very classical piece of work that frequently appears when one pursues studies in such topics. If it doesn't play, follow this link.

In the .gif, we begin with the red function in real space, and proceed to find its Fourier Series; rewriting it as a sum of sines and cosines. These terms are then categorized by their frequency, or harmonics, and their amplitudes (or coefficients) are kept in the new representation. We finally arrive at the Fourier-transformed expression of our original function which conventionally takes the form . In other words, we have thrown out all ideas about writing the sines and cosines; after all, if its already our choice of basis, why do we need to keep any resemblance of how the sinusoidal functions appear? Rather, we keep, in the new axis, the harmonic number, also conventionally (hence space, despite using above), as well as its relative amplitude, or in the new axis. This use of new coordinate bases is known as frequency space, as mentioned before, because the axis now describes the frequency of the wave there (called the spectrum). In mathematical jargon, the Fourier Transform takes the form
And this is nothing but fancy handwriting and nerdy math for saying that the recipe to perform a Fourier Transform is to multiply a function by an exponential term (well, in truth really the cosine and sine, if you remember your complex exponentials), and integrating across all values (again, the same pattern as the dot-products showing up again). Beyond here is a lot of weird, funky functions like distributions that technically don't exist, imaginary terms and weird reflections. It is definitely beyond the scope of what is needed here, but perhaps to wrap it all up, is a more visually meaningful description of how Fourier Transform helps in solving many problems: signal processing and reconstruction. A common and famous file format for music is .mp3. The reason why they are relatively small is because of Fourier Transforms: music is stored in Fourier space and reconstructed back to give the original waveforms of the music3.

1 https://upload.wikimedia.org/wikipedia/commons/d/df/Fourier2_-_restoration1.jpg ↩
2 https://medium.com/@khairulomar/deconstructing-time-series-using-fourier-transform-e52dd535a44e
3 Seeber, R., Ulrici, A. Analog and digital worlds: Part 1. Signal sampling and Fourier Transform. ChemTexts 2, 18 (2016). https://doi.org/10.1007/s40828-016-0037-1
As always, you can play with the workings behind this little work at this Desmos link here and here.